
Most lead scoring models don't work. Not in a "they could be better" way — in a "the scores have zero correlation with actual conversion" way. Teams spend months building scoring models in HubSpot or Marketo, assigning points for email opens and page visits, and defining an MQL threshold that triggers a handoff to sales. Then nobody checks whether the MQLs actually convert at a higher rate than non-MQLs.
When someone finally does that analysis, the result is usually uncomfortable: MQLs convert at 14% and non-MQLs convert at 11%. The scoring model added 3 months of work and infrastructure for a 3-percentage-point lift that might be within the margin of error.
Here's how to build a model that actually predicts who will convert — and more importantly, who should get a fast response.
Why most scoring models fail
Traditional lead scoring assigns points for behavioral signals — email opens, page visits, content downloads, webinar attendance. The assumption is that more engagement equals more buying intent.
The problem is that engagement and intent are weakly correlated in B2B. A marketing coordinator who opens every email and downloads every whitepaper scores higher than a VP who visits the pricing page once. The coordinator gets flagged as an MQL. The VP doesn't. Sales calls the coordinator and gets nowhere. The VP talks to a competitor who responded faster.
Behavioral scoring measures attention, not intent. And attention is cheap — especially when much of it is automated (email opens inflated by email clients) or habitual (people who consume content but never buy).
The signals that actually predict conversion
| Signal | Predictive value | Why |
|---|---|---|
| Stated timeline | Highest | "Evaluating this quarter" vs. "sometime next year" is the single most predictive data point. Leads with an active timeline convert at 5–10x the rate of leads who are just exploring. |
| Company fit (size, industry, revenue) | High | Does this company match your ICP? A perfect-fit company with minimal engagement is more likely to convert than a poor-fit company with high engagement. |
| Budget acknowledgment | High | A lead who selects a budget range that matches your pricing has removed the #1 objection before the first conversation. |
| Pricing page visits | High | The pricing page is the strongest single behavioral signal on most B2B sites. It indicates active cost evaluation. |
| Return visits | Medium-high | Visiting the site 3+ times in a week indicates ongoing evaluation. More predictive than total page views. |
| Form type | Medium-high | Demo requests convert at 3–5x the rate of content downloads. The form itself is a signal. |
| Job title / seniority | Medium | Decision-makers convert at higher rates than researchers. But title alone isn't predictive — it's predictive in combination with other signals. |
| Email opens / content downloads | Low | Weakly correlated with conversion. Too noisy to be useful as primary scoring inputs. |
The top three signals — timeline, company fit, and budget — are all data points you can capture on a form. They don't require weeks of behavioral tracking. They're available at the moment of capture.
Build the model in three layers
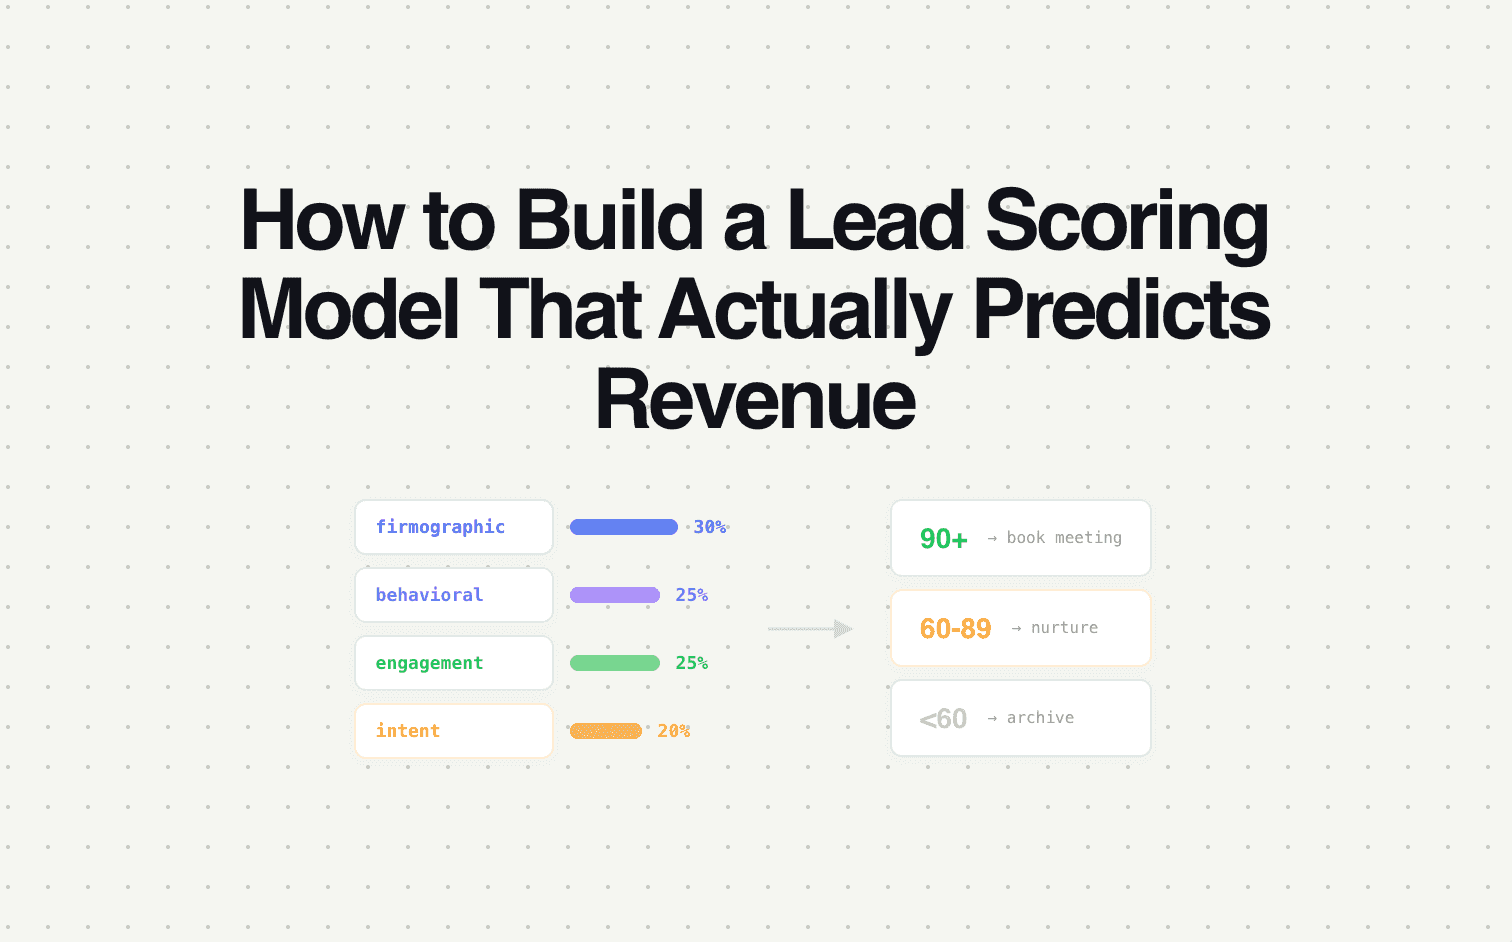
Layer 1: Fit score (firmographic). Does this lead match your ICP? Evaluate company size, industry, revenue, and geography against your ideal customer profile. This is a binary or tiered score: strong fit, moderate fit, poor fit. Data comes from form fields + enrichment.
Layer 2: Intent score (stated + behavioral). What is this lead's buying intent right now? Evaluate stated timeline, budget acknowledgment, form type, pricing page visits, and return visit frequency. This is the urgency dimension — not just "are they a good fit?" but "are they ready now?"
Layer 3: Combined score and routing trigger. Combine fit and intent into a matrix:
| High intent | Medium intent | Low intent | |
|---|---|---|---|
| Strong fit | Route to senior AE immediately | Route to SDR same-day | Nurture — high-value, not ready |
| Moderate fit | Route to SDR immediately | Nurture — build relationship | Low priority nurture |
| Poor fit | Evaluate manually — might be a new segment | Nurture — low investment | Auto-disqualify |
This matrix replaces the single MQL threshold with a two-dimensional routing decision. "Strong fit + high intent" gets an instant response. "Moderate fit + low intent" gets automated nurture. The scoring model doesn't just score — it decides what happens next.
Calibrate with actual outcomes
The model is only useful if it predicts real conversion. After 30 days of running it, pull the data:
For each cell in the matrix, what's the lead-to-meeting rate? If "strong fit + high intent" leads convert at 45% and "strong fit + medium intent" leads convert at 20%, the model is working — it's differentiating meaningfully.
If two cells have similar conversion rates, merge them. The model should create groups with meaningfully different outcomes. If medium and low intent convert at the same rate, your intent signals aren't discriminating well — refine the inputs.
If the model doesn't predict, simplify. A complex model that doesn't predict conversion is worse than a simple one that does. Start with fit + timeline only. Add signals when you have enough data to validate them.
Where Surface fits
Surface builds scoring into the capture flow — fit score from form data + enrichment, intent score from stated timeline + behavioral signals, combined into a routing decision that triggers instantly. No batch processing, no scoring that runs overnight, no MQL threshold that someone set 18 months ago.
If your current scoring model can't demonstrate a meaningful conversion difference between high-scoring and low-scoring leads, the model isn't working. Surface was built to replace it with one that scores at capture and routes on the result.